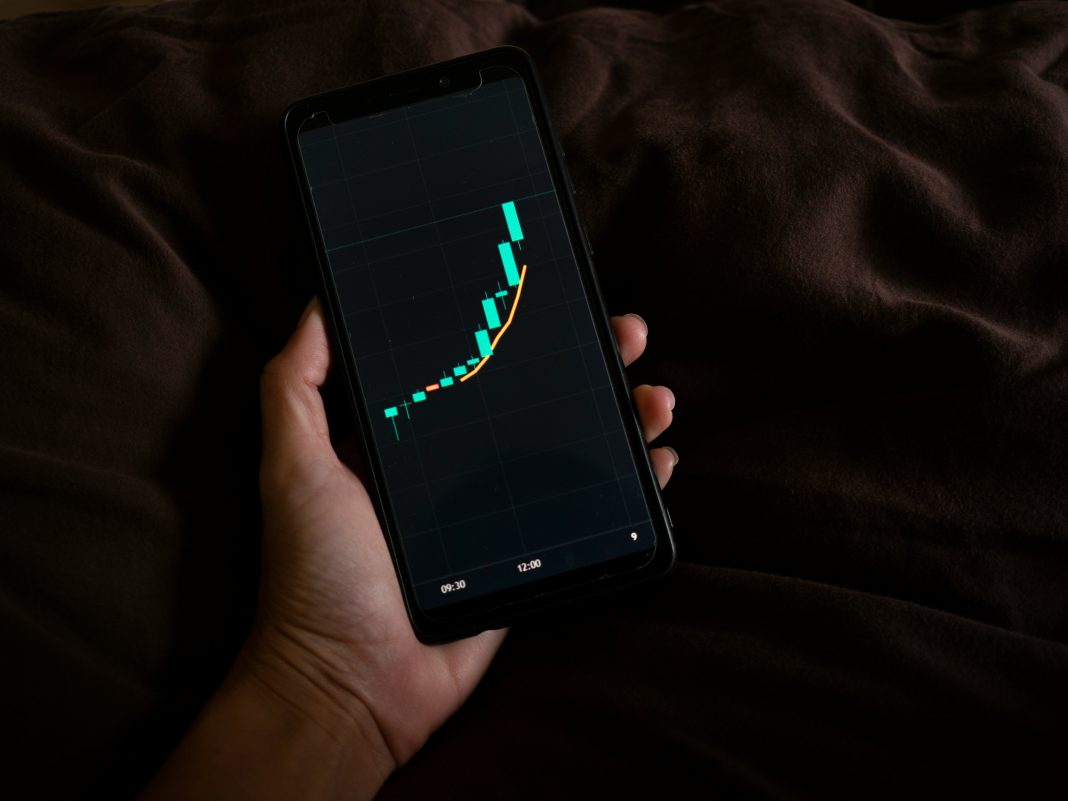
Candlestick charts are a cornerstone of technical analysis in the stock market, offering detailed insights into price movements and market sentiment over specific periods. Originating from 18th-century Japan, these charts are not only visually compelling but also rich in information, allowing traders to make informed decisions. This guide will help you understand how to interpret various candlestick patterns and how they can be used to analyze stock performance effectively.
1. Understanding the Basics of Candlestick Charts
- Structure of a Candlestick: Each candlestick typically represents one day of trading and consists of a body and wicks (or shadows). The body shows the opening and closing prices, while the wicks represent the high and low prices during the trading day. A filled or colored body indicates the stock closed lower than it opened, while a hollow or uncolored body shows it closed higher.
- Reading the Patterns: Candlesticks are grouped into patterns that predict potential market movements. These patterns can be bullish (indicating a potential rise in price), bearish (suggesting a potential fall), or neutral.
2. Common Candlestick Patterns
- Single Candlestick Patterns:
- Doji: The opening and closing prices are virtually the same, suggesting indecision in the market. It can signal a reversal or a continuation, depending on previous candles.
- Hammer and Hanging Man: These patterns have small bodies and long lower wicks. A hammer (bullish) occurs after a decline and suggests a potential upside reversal. A hanging man (bearish) appears after an advance and warns of a potential downside reversal.
- Multiple Candlestick Patterns:
- Engulfing: This is a two-candle pattern where a small candle is followed by a much larger opposite-coloured candle that “engulfs” the smaller one. A bullish engulfing pattern suggests a potential upward move, while a bearish engulfing indicates a possible downward trend.
- Morning Star and Evening Star: These are three-candle patterns that signal reversals. A morning star (bullish) follows a downtrend with a short-bodied candle between two long ones, suggesting a rally. An evening star (bearish) follows an uptrend and indicates a potential fall.
3. Strategies for Trading Candlestick Patterns
- Confirmation: Always wait for confirmation with additional candles following the pattern to validate potential reversals or continuations.
- Combine with Other Indicators: Use candlestick patterns in conjunction with other technical analysis tools like moving averages, RSI (Relative Strength Index), or MACD (Moving Average Convergence Divergence) for more reliable signals.
- Volume Analysis: Consider the trading volume associated with particular candlestick patterns. High volume can confirm the strength of the signal, especially in patterns like engulfing.
4. Psychological Insights
- Market Sentiment: Candlestick patterns reflect underlying market psychology and sentiment. Understanding these can provide insights into investor behavior and potential market moves.
- Pattern Recognition: Developing a skill in recognizing patterns quickly can significantly enhance trading decisions. Practice is key to becoming proficient.
5. Limitations and Cautions
- False Signals: Not all candlestick patterns will lead to expected outcomes. Market conditions, news, and other factors can influence the effectiveness of a pattern.
- Risk Management: Always have a clear risk management strategy in place. Set stop-loss orders to minimize potential losses when the market moves against your expectations.
Candlestick patterns are a powerful tool for predicting short-term price movements and enhancing your trading strategy. By understanding and correctly interpreting these patterns, traders can improve their ability to make informed decisions in the stock market. Remember, while highly informative, candlesticks should not be used in isolation but rather as part of a comprehensive trading plan that includes sound risk management practices.


